- Home
- Corporate Profile
- Forecast
- Earthquake
- Observation
- Climate
- Publication
- Education
- Contact Us
-
Talian Hotline1-300-22-1638
Talian Hotline
1-300-22-1638
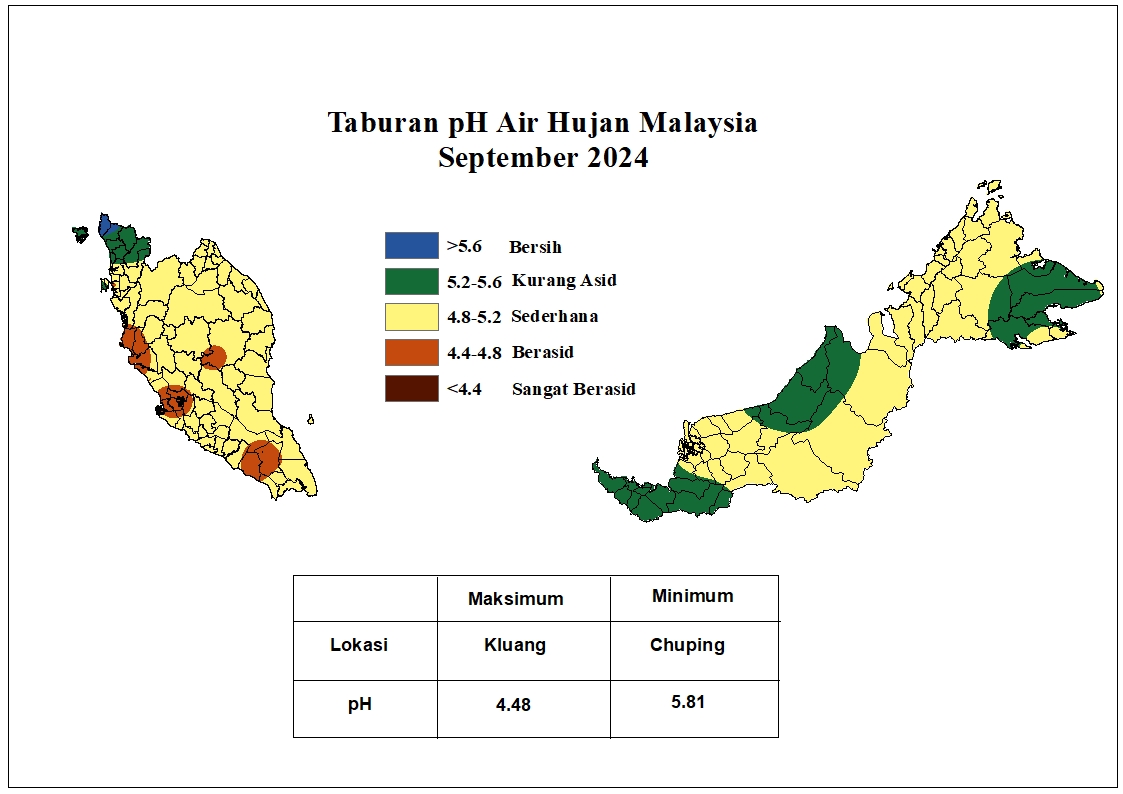
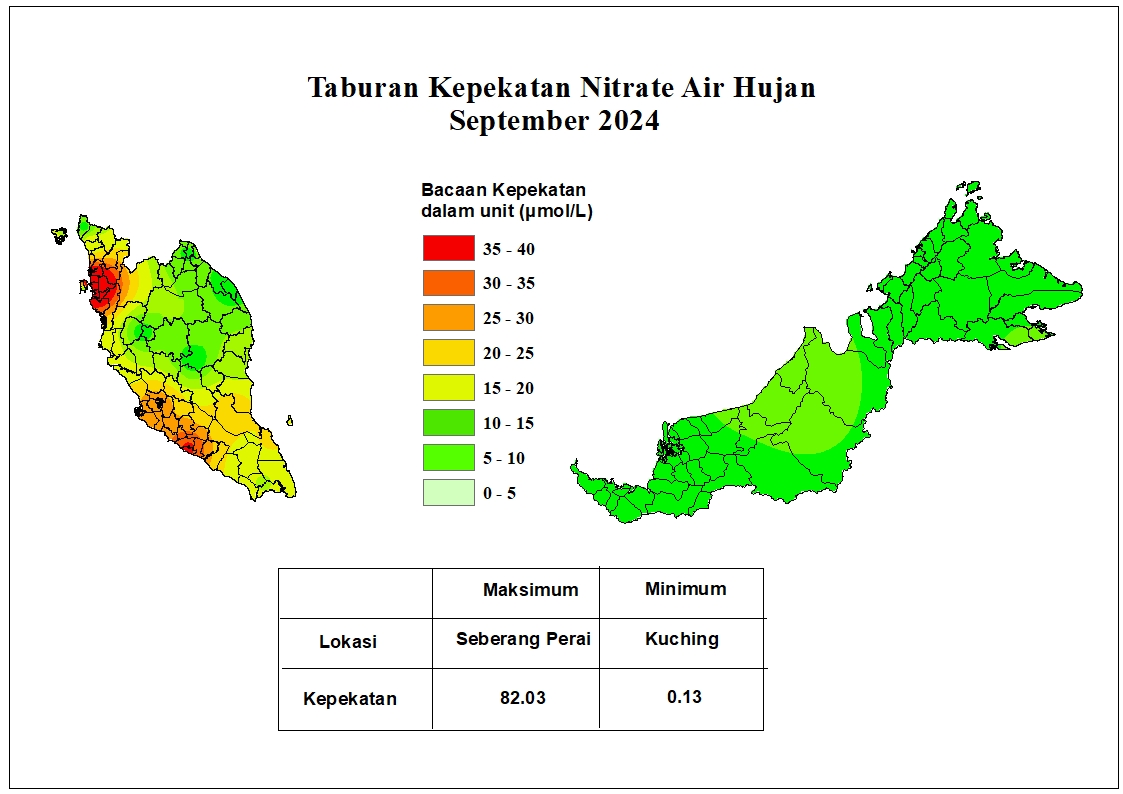
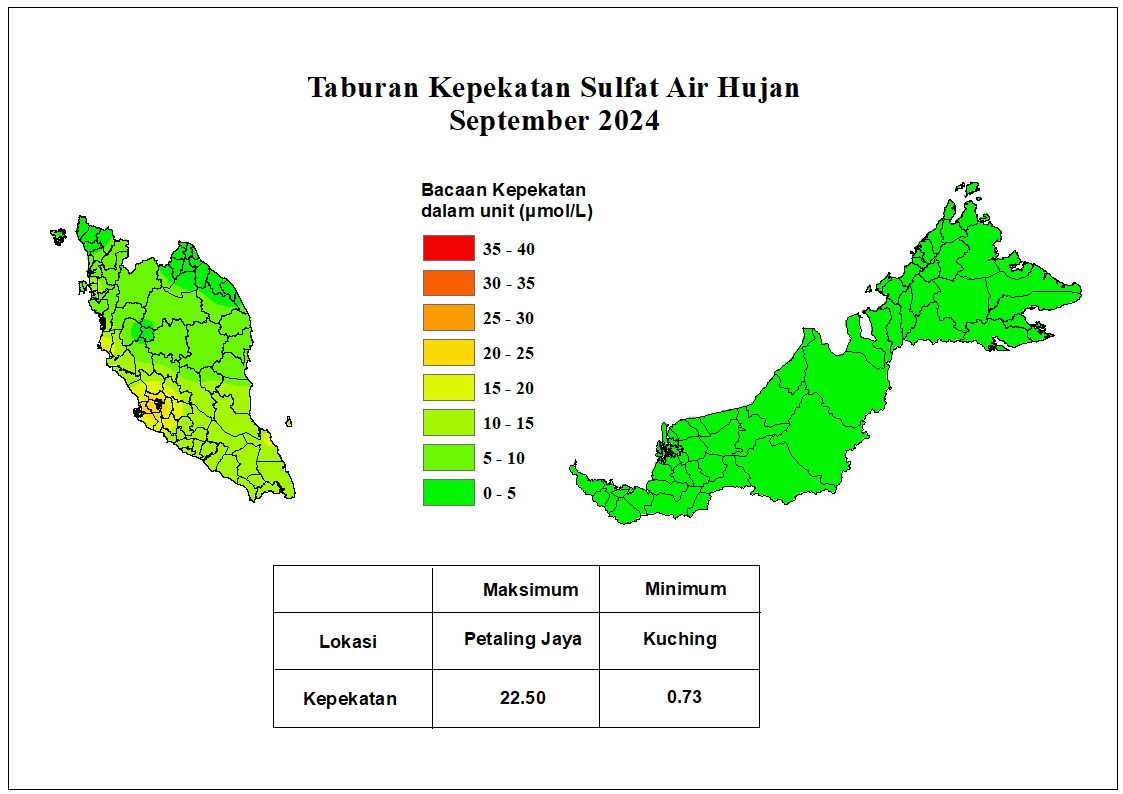
The monthly pH and concentration maps represent the spatial interpolation of point observation data from field measurement stations operated by the Malaysian Meteorological Department nationwide. The quality of the point observation data used has been verified as high quality. The pH and concentration gradient maps were generated using the Inverse Distance Weighting (IDW) interpolation method. These maps aim to show the regional trends for pH, sulfate, and nitrate concentrations in Malaysia. Uncertainty in measurement and spatial interpolation is unavoidable in this process. Specifically, the interpolation uncertainty is greater the further a location is from the closest known data point. The unit of measurement used for nitrate and sulfate concentrations is micromoles per liter (µmol/L).
Rain is generally acidic in nature due to the natural and anthropogenic presence of sulfuric, nitric, and carbonic acids in the atmosphere. Consequently, the categorization of acid rain does not necessarily follow the typical representation of a pH value less than 7. The acidity of rainwater shown on the monthly pH charts below can be categorized as follows: Clean (>5.6), Slightly Acidic (5.2 - 5.6), Moderate (4.8 - 5.2), Acidic (4.4 - 4.8), and Highly Acidic (<4.4). Rainwater is defined as 'Acid Rain' when the pH value is 4.4 and below. This definition is consistent with the definition used by the United States Environmental Protection Agency (US EPA).
**Inverse Distance Weighting (IDW):https://pro.arcgis.com/en/pro-app/help/analysis/geostatistical-analyst/how-inverse-distance-weighted-interpolation-works.htm